Overview Dashboard
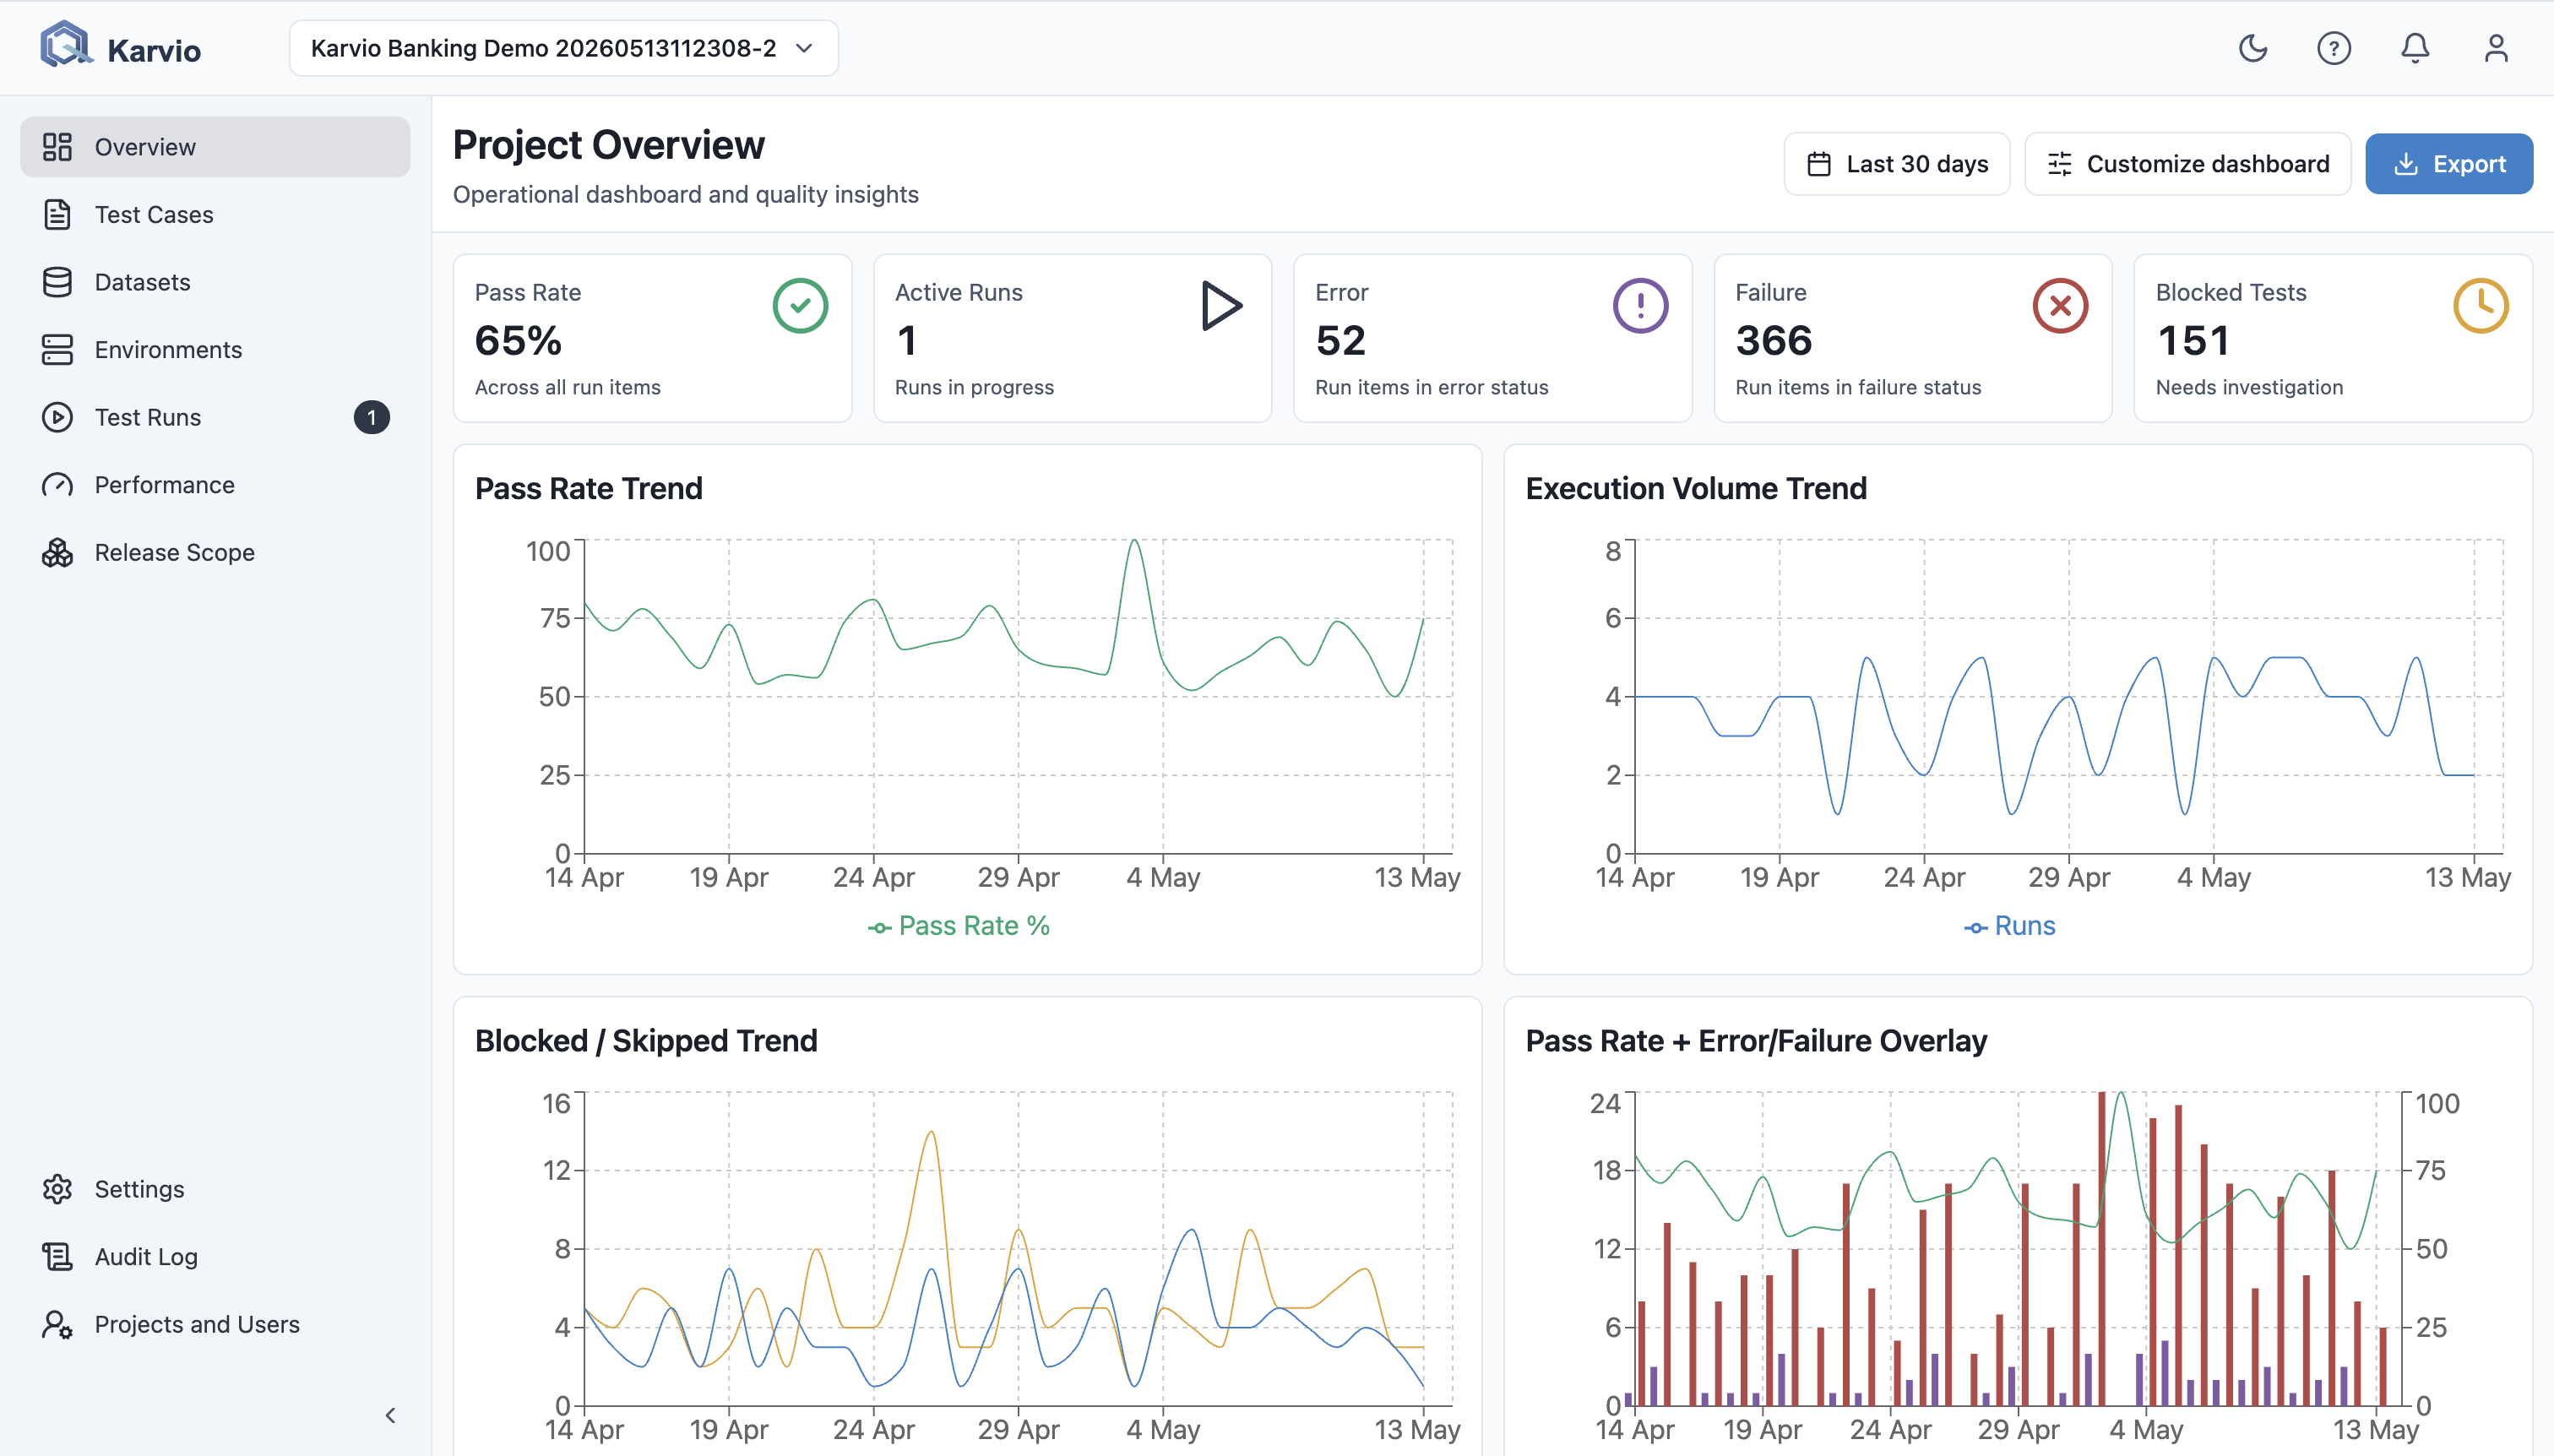
The Overview dashboard gives you a real-time picture of testing activity in the current project. It aggregates results across all runs in a configurable date range and visualizes trends, pass rates, and team execution.
Use it during daily QA review, release readiness meetings, and post-release analysis.
Opening the Dashboard
Click Overview in the left sidebar. The dashboard loads with the default date range (last 30 days) applied.
Date Range and Filters
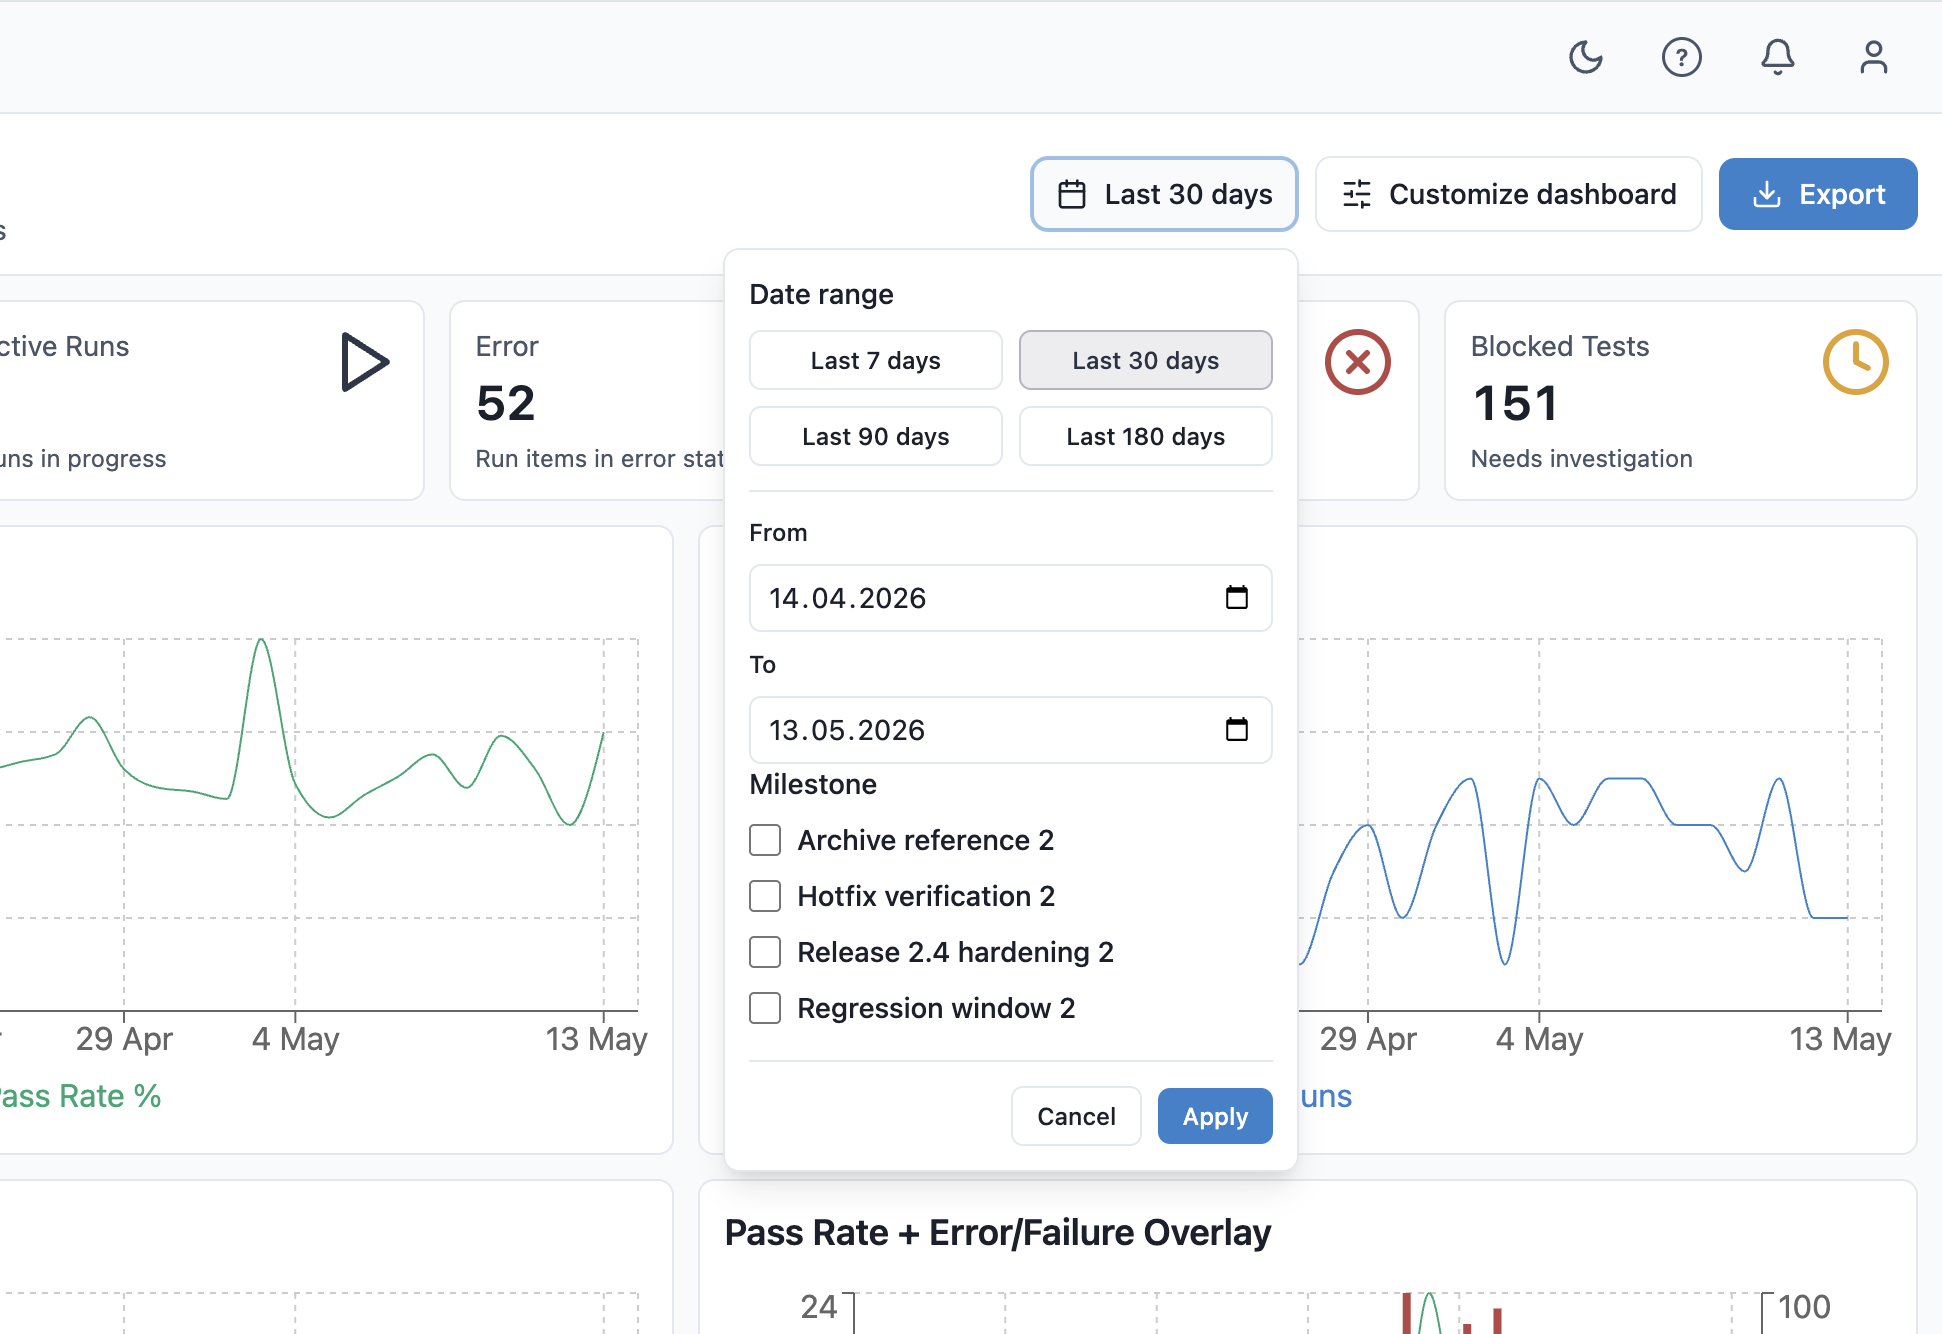
Use the controls at the top of the dashboard to adjust the scope of data:
| Control | Description |
|---|---|
| Date Range | Custom start and end date |
| Preset | Quick selection: Last 7 days / 30 days / 90 days / 180 days |
| Milestone | Limit the dashboard to runs linked to a specific milestone |
All widgets update immediately when you change these controls.
Dashboard Widgets
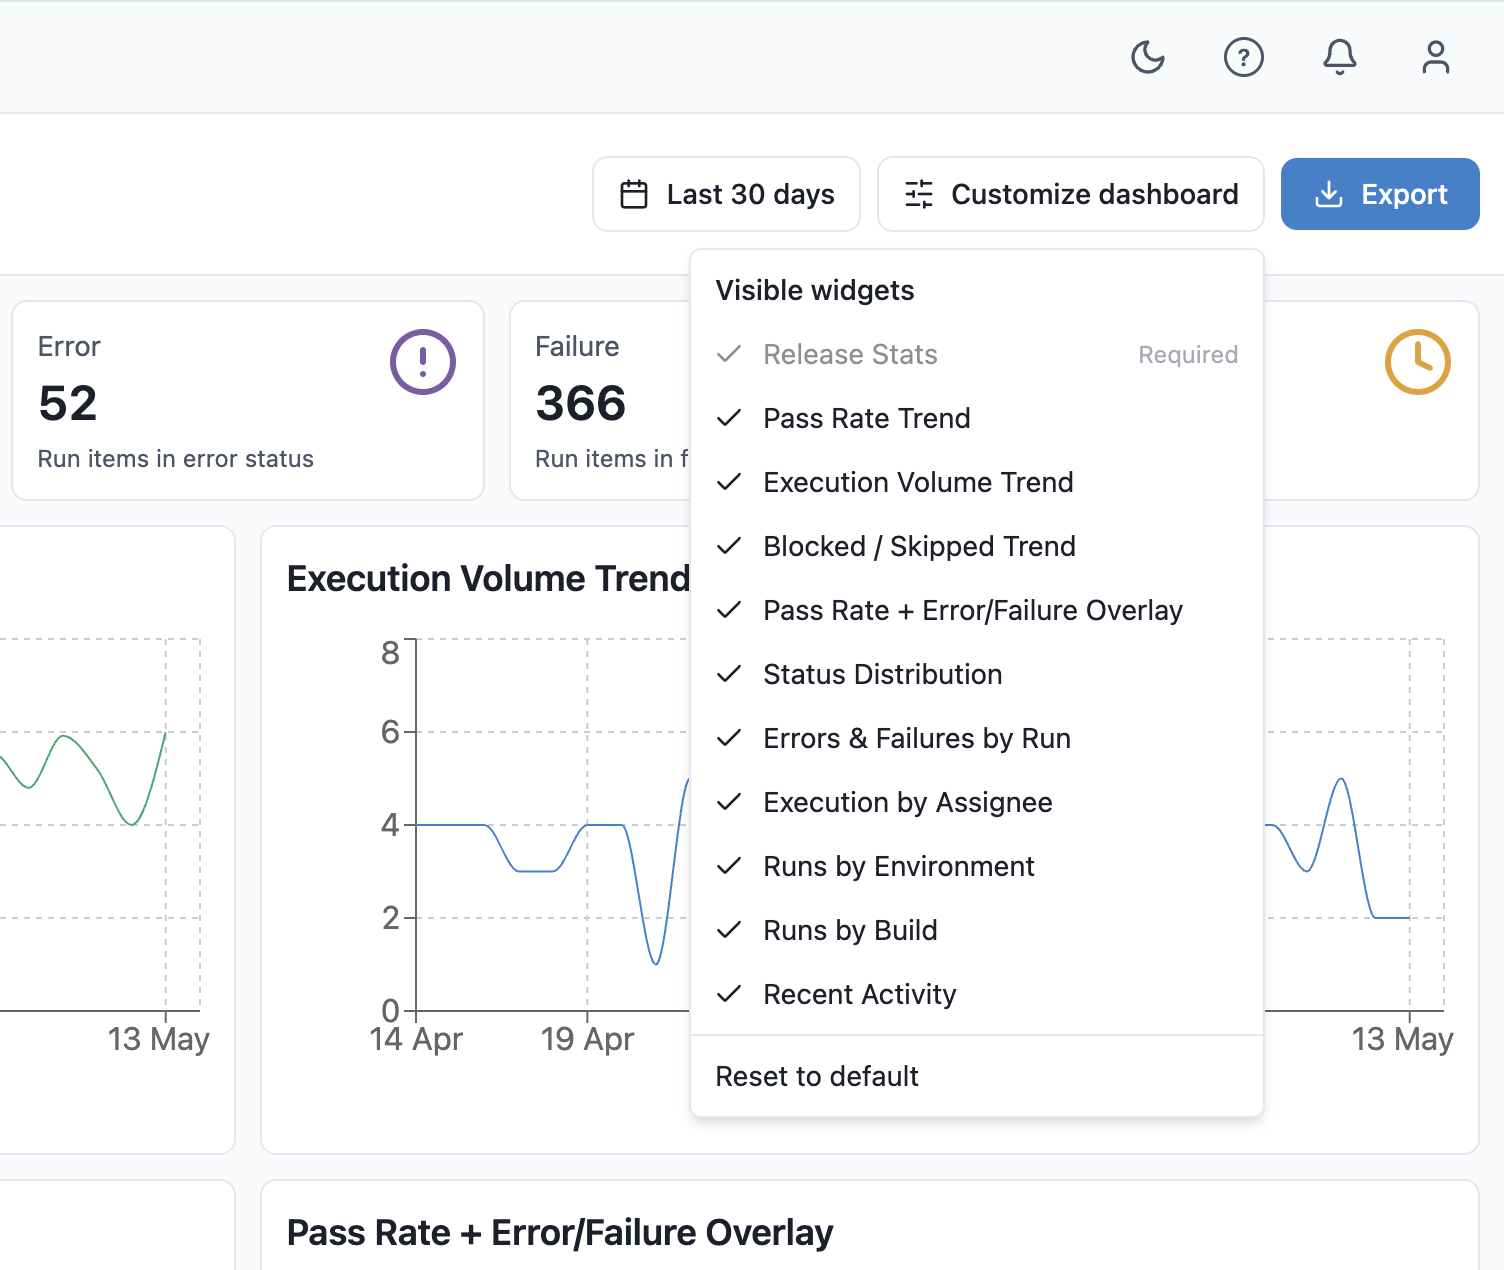
The dashboard is composed of independent widgets, each showing a different view of your testing data. You can show or hide individual widgets to focus on what matters to your team.
Release Statistics
A summary of results for the selected period:
- Total test executions
- Passed / Failed / Blocked counts
- Overall pass rate
Pass Rate Trend
A line chart showing how the pass rate has changed over time within the selected date range. Use this to spot regressions introduced by specific builds or releases.
Execution Trend
A bar chart showing the volume of test executions per day. Useful for understanding testing cadence and identifying gaps in coverage.
Status Distribution
A donut or pie chart showing the proportion of Passed / Failed / Blocked / Not Applicable results.
Failure Breakdown by Run
A breakdown of failures grouped by test run. This helps identify which runs contribute the most failures and deserve investigation.
Test Execution by Assignee
A horizontal bar chart showing how many tests each team member has executed. Use this to monitor workload distribution.
Tests by Environment
A view of execution counts and pass rates grouped by environment. Useful for comparing how a build performs on different platforms.
Tests by Build
A view of execution counts and pass rates grouped by build or version. Use this to track quality improvements or regressions across releases.
Recent Activity
A chronological feed of the most recent test results recorded in the project, including the tester name and timestamp.
Show and Hide Widgets
- Click Customize (or the widget settings icon) in the dashboard toolbar.
- Toggle individual widgets on or off.
- Click Save.
Your widget preferences are saved per user and persist across sessions.
Reset to Default
Click Reset in the customize panel to restore the default widget layout.
Export Dashboard Data
Click Export → JSON to download the raw data powering the dashboard. This is useful for building custom reports or feeding data into other tools.
How to Read the Dashboard
| Signal | What to check |
|---|---|
| Falling pass rate | Identify the build, environment, or run where the drop started. |
| High blocked count | Review environment stability, missing data, or upstream dependencies. |
| Failures concentrated in one run | Open that run and review failed items and defects. |
| Failures concentrated by environment | Compare environment configuration and recent changes. |
| Low execution volume | Confirm the date range and whether planned runs were actually started. |
| Uneven assignee distribution | Reassign run items or adjust future planning. |